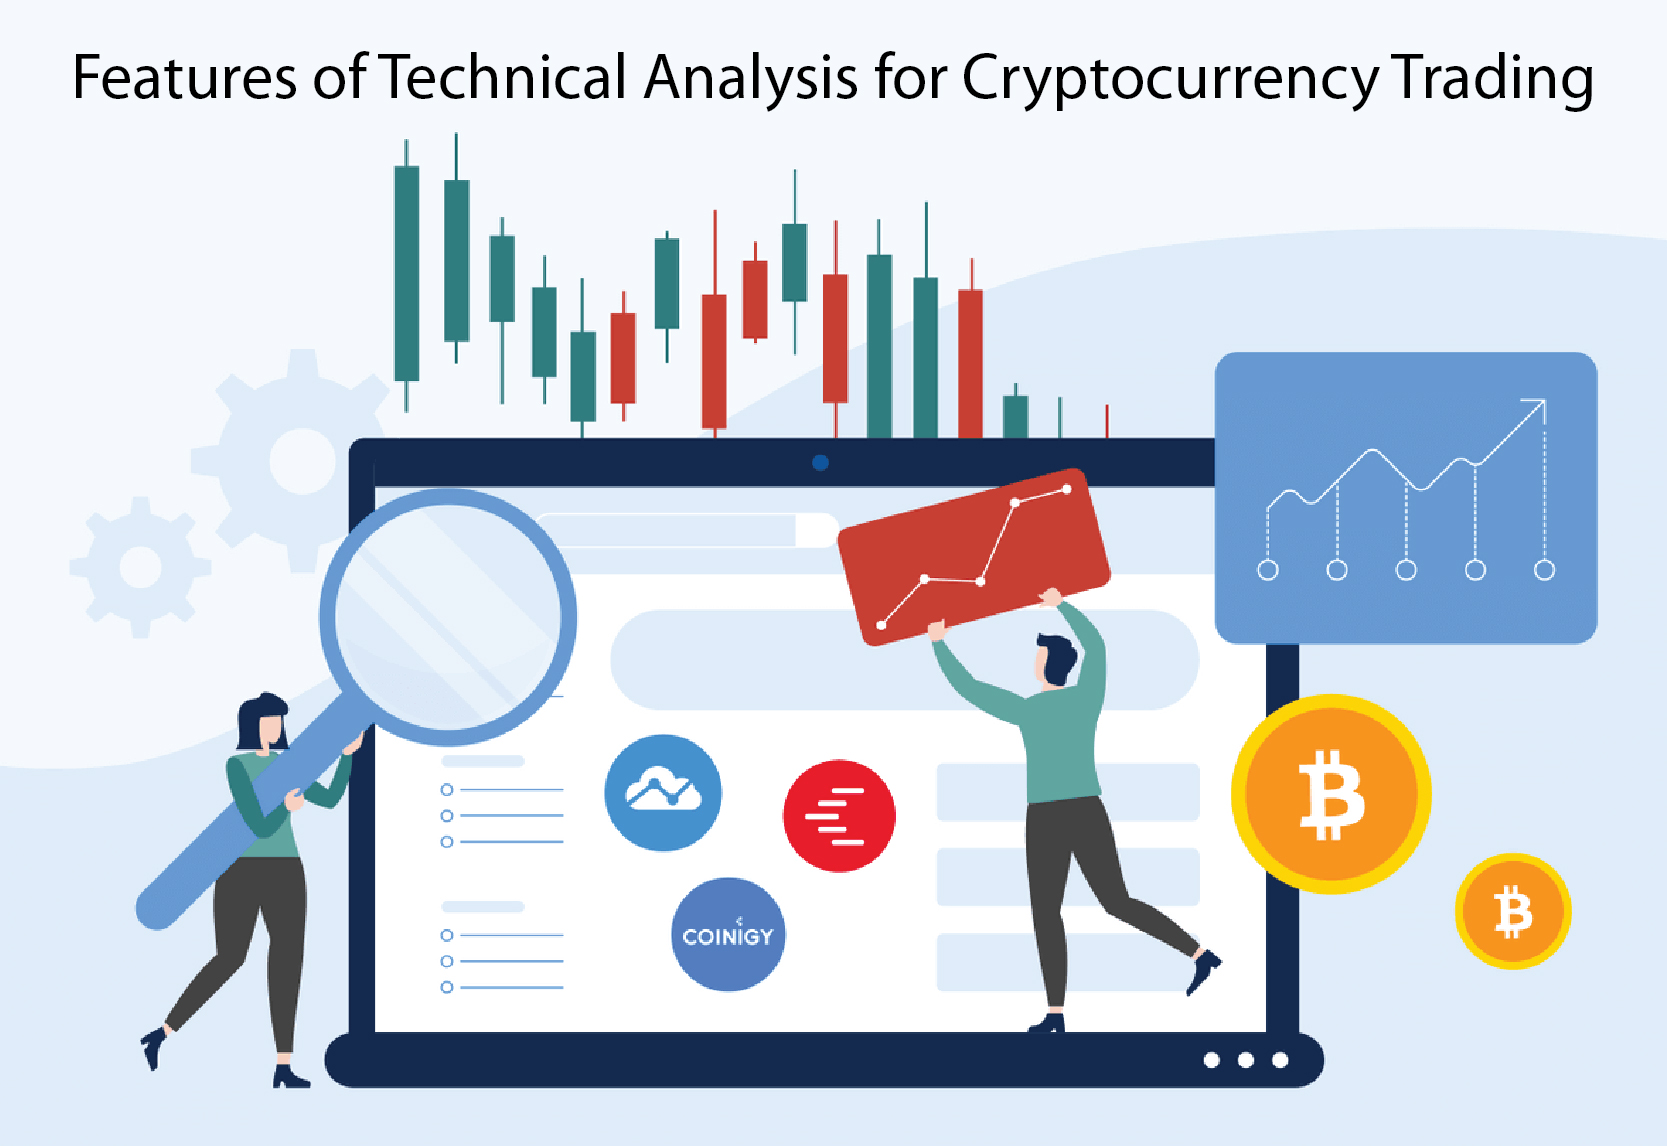
Features of Technical Analysis for Cryptocurrency Trading
Technical analysis plays a crucial role in cryptocurrency trading, helping traders make informed decisions based on historical price patterns and market trends. By analyzing price charts and utilizing various indicators, technical analysis empowers traders to identify potential entry and exit points, forecast price movements, and manage risk effectively. This article explores the critical technical analysis features of cryptocurrency trading, highlighting its benefits, tools, and strategies that can enhance trading performance and profitability.
Historical Price Patterns
One of the primary features of technical analysis is the examination of historical price patterns. Traders analyze charts to identify recurring patterns, such as support and resistance levels, trends, and chart formations. These patterns provide insights into market sentiment and can help traders predict future price movements.
Indicators and Oscillators
Technical analysis employs a wide range of indicators and oscillators to interpret price data and derive trading signals. These tools include moving averages, Relative Strength Index (RSI), Moving Average Convergence Divergence (MACD), and Bollinger Bands. Indicators help traders identify overbought or oversold conditions, confirm trend direction, and generate entry and exit signals.
Trend Analysis
Trend analysis is a fundamental aspect of technical analysis. Traders identify and follow trends to capitalize on price movements. They distinguish between uptrends, downtrends, and sideways trends to align their trades with the prevailing market direction. Trend lines and moving averages are commonly used tools for trend analysis.
Support and Resistance Levels
Support and resistance levels are crucial elements in technical analysis. Support levels represent price levels where buying pressure is expected to outweigh selling pressure, leading to a potential price rebound. On the other hand, resistance levels indicate price levels where selling pressure may overpower buying pressure, potentially leading to price reversals. Identifying these levels assists traders in setting profit targets and managing risk.
Candlestick Patterns
Candlestick patterns provide valuable insights into price action and market psychology. Traders analyze candlesticks’ shape, size, and color to identify patterns, such as doji, hammer, engulfing, and spinning top. These patterns can indicate potential trend reversals or continuation, providing traders with entry and exit signals.
Volume Analysis
Volume analysis is an essential component of technical analysis. It helps traders assess the strength of price movements and validate the significance of trends or patterns. The high trading volume during price breakouts or reversals can confirm market sentiment and increase the reliability of trading signals.
Timeframes and Chart Types
Technical analysis allows traders to analyze price data across different timeframes and chart types. Short-term traders may focus on intraday charts, while long-term investors may examine weekly or monthly charts. Chart types, such as line charts, bar charts, and candlestick charts, offer varying levels of detail and visual representation.
Risk Management and Stop Loss Orders
The technical analysis integrates risk management techniques into trading strategies. Traders use stop-loss orders to limit potential losses if the market moves against their positions. By setting stop loss levels based on technical analysis, traders can protect their capital and manage risk effectively.
Backtesting and Strategy Development
Technical analysis enables traders to backtest and refine trading strategies. By applying historical price data to their strategies, traders can assess the profitability and reliability of their approach. Backtesting helps traders identify optimal entry and exit points, refine risk management parameters, and improve overall trading performance.
Psychological Factors and Sentiment Analysis
The technical analysis considers psychological factors and sentiment analysis to gauge market sentiment. Traders analyze price patterns and indicators to understand the emotions and behavior of market participants. This understanding can provide insights into potential market reversals or continuation.
Conclusion
Technical analysis offers valuable features and tools for cryptocurrency traders. Traders can make informed trading decisions by analyzing historical price patterns, using indicators and oscillators, identifying trends and support/resistance levels, and considering volume and candlestick patterns. Moreover, technical analysis aids in risk management, strategy development, and understanding market sentiment. Incorporating these features into cryptocurrency trading, strategies can enhance trading performance, increase profitability, and contribute to overall trading success.